Review Results
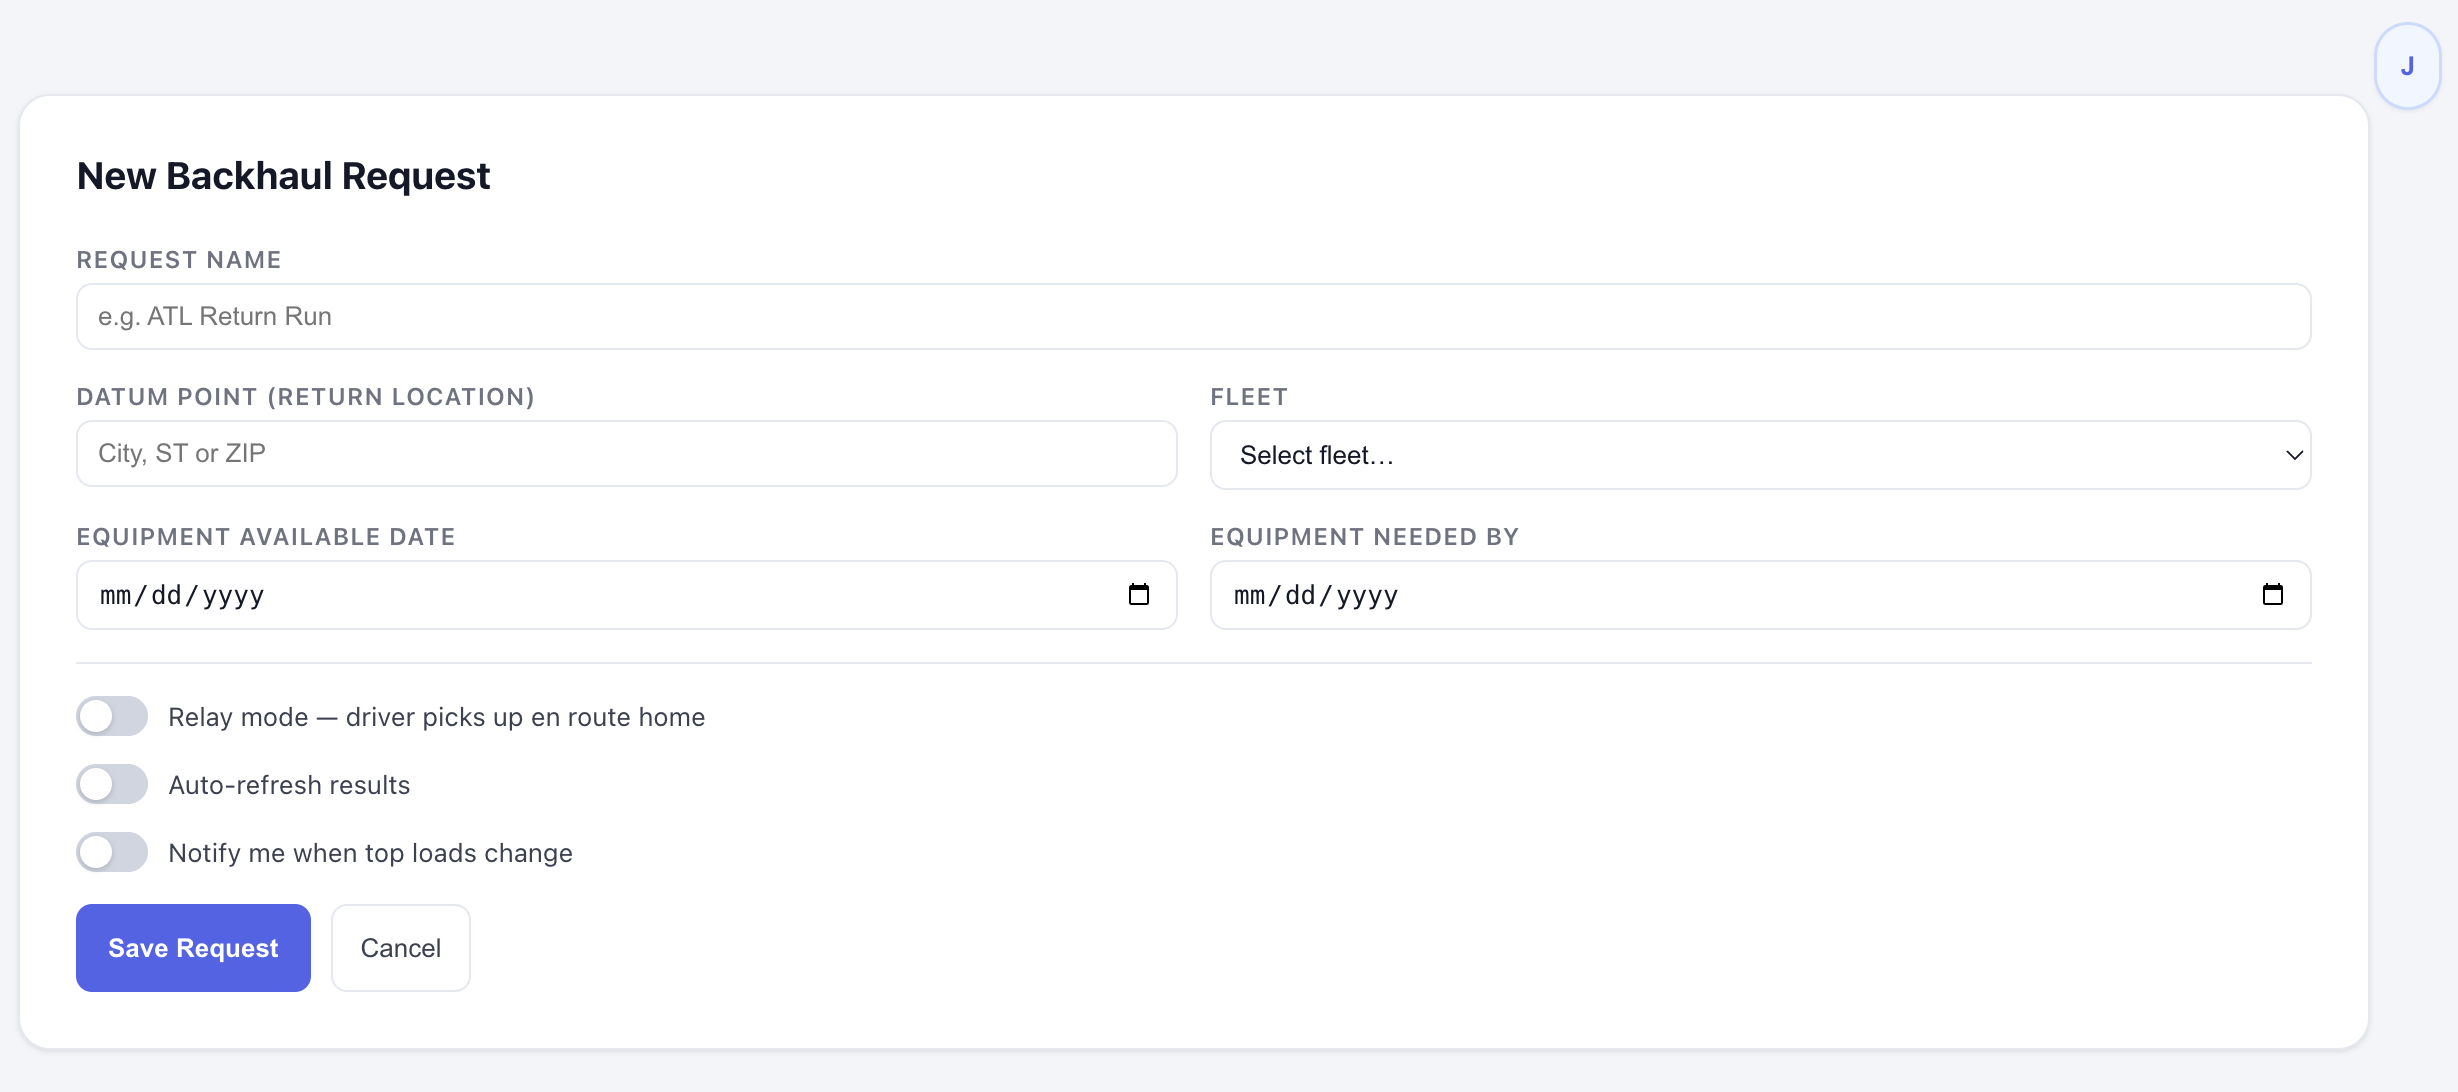
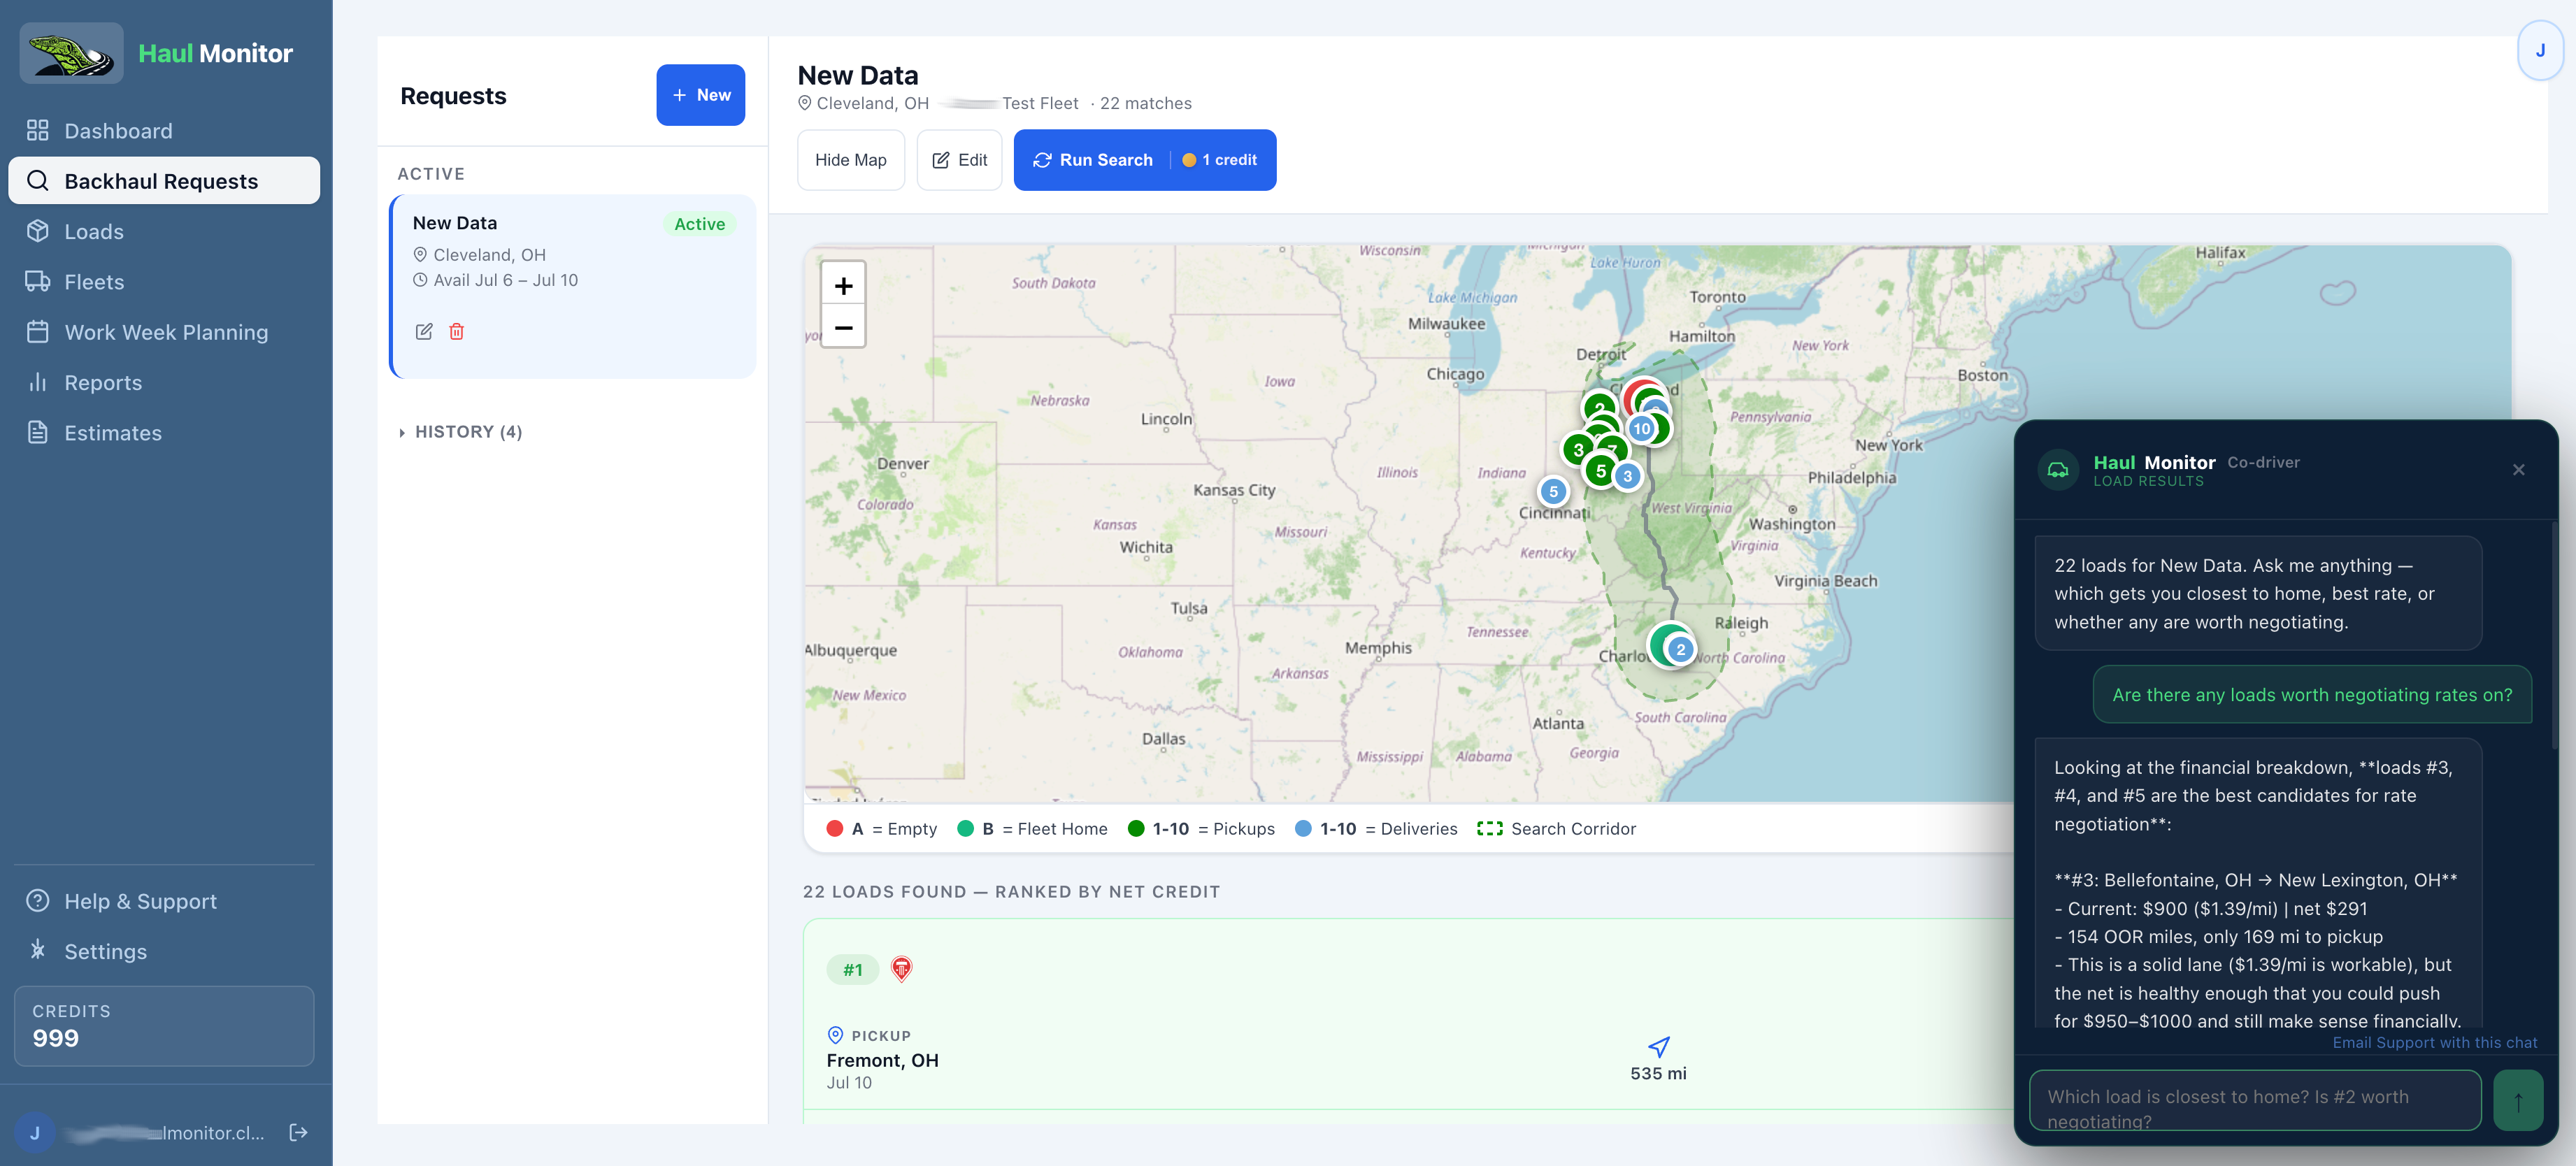
Your request appears in Search. Click a request to open the full results view, and Run Search to execute the search.
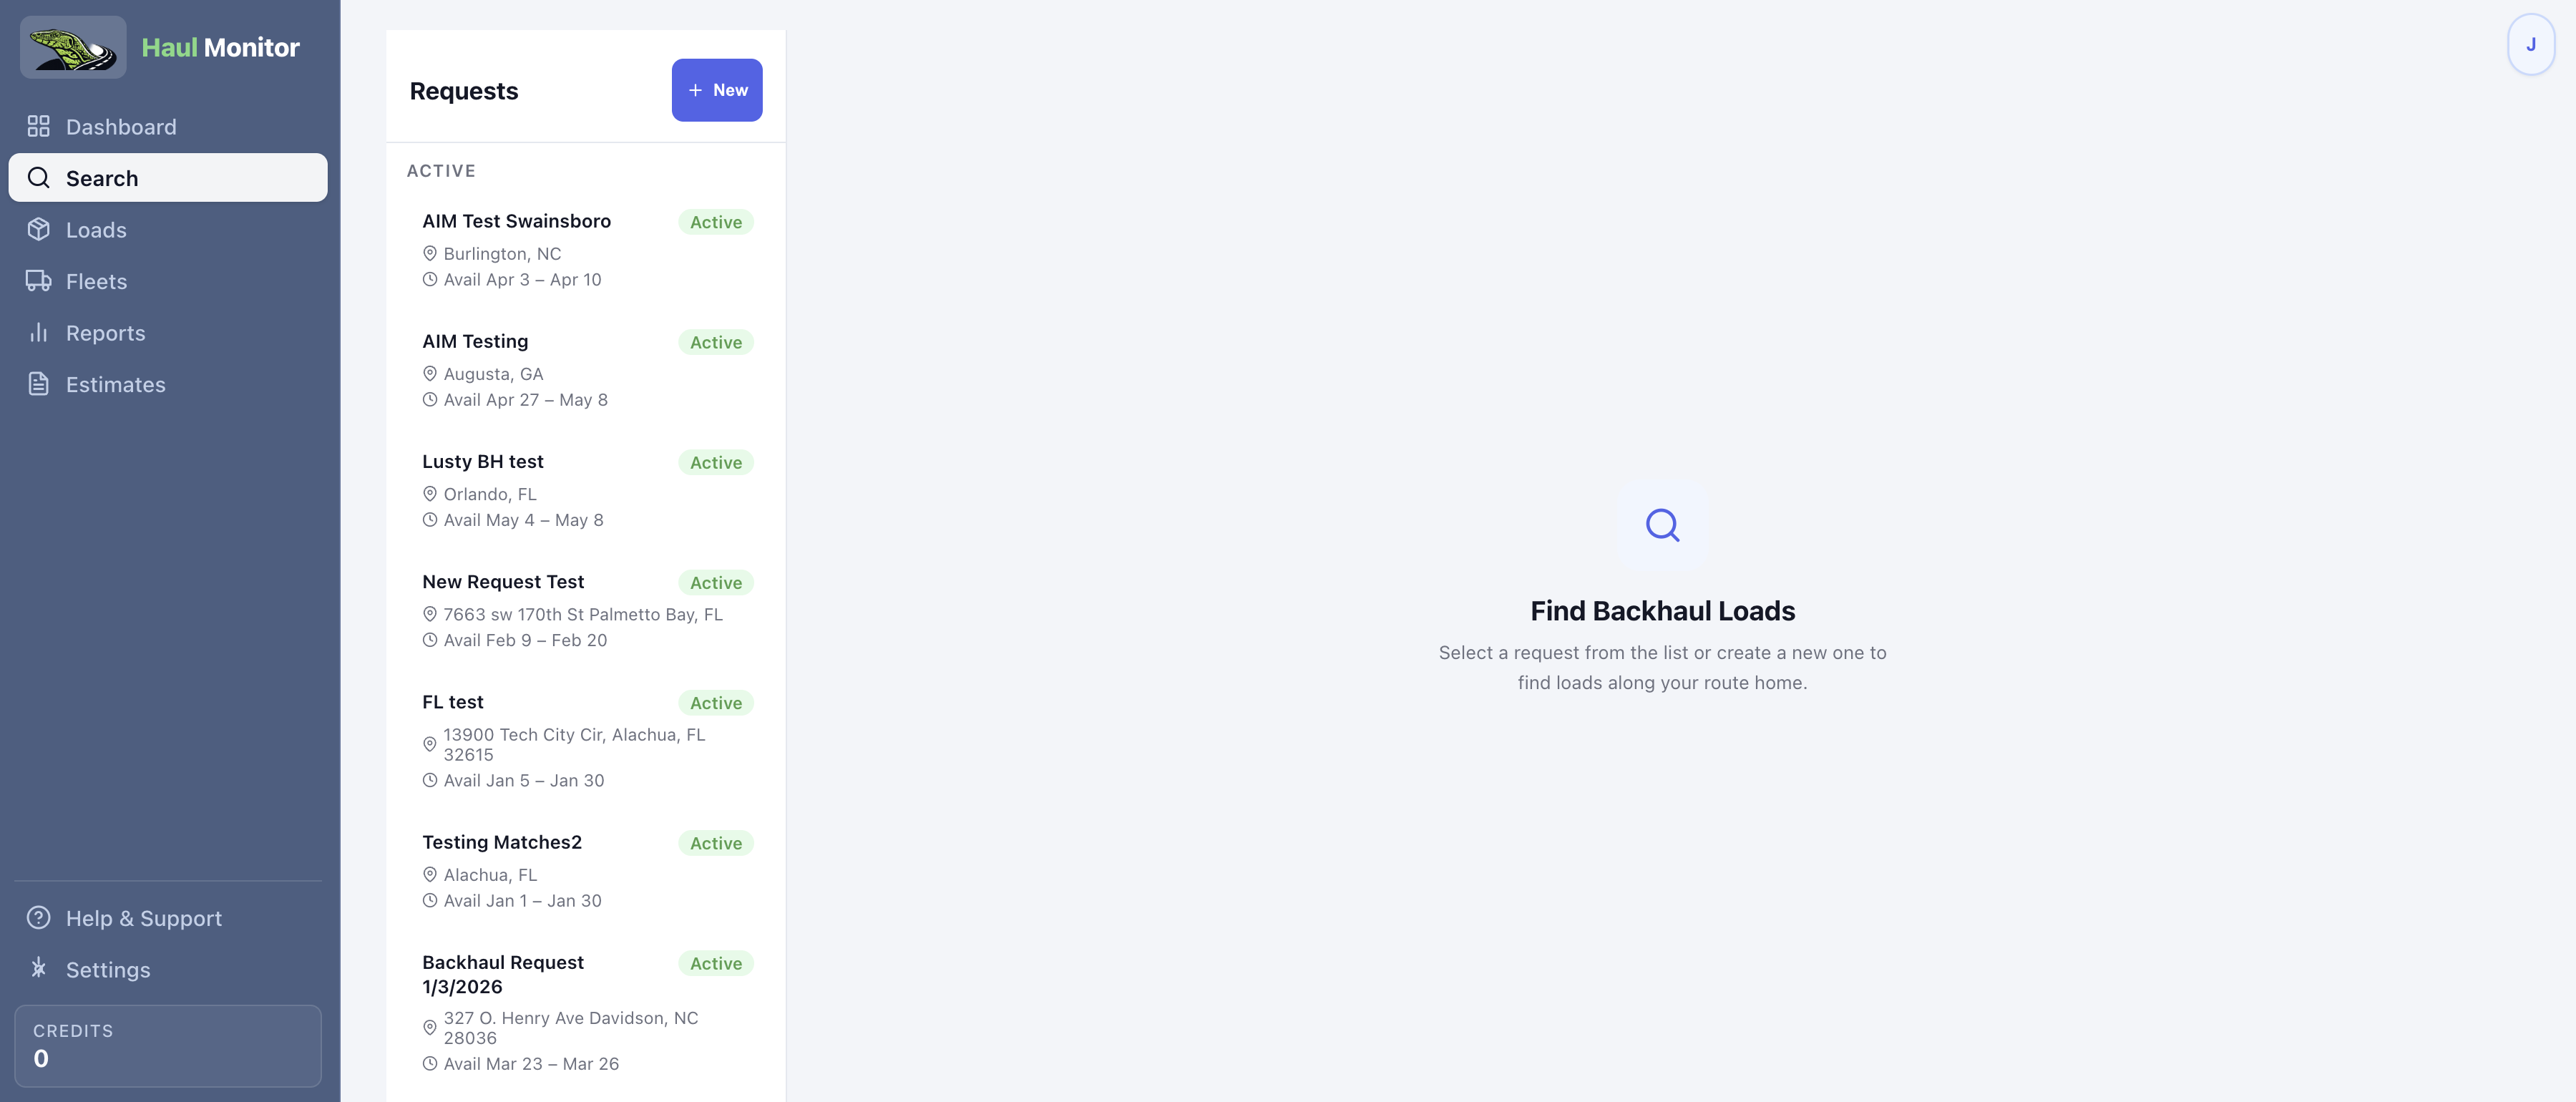
The Route Map shows the top 10 opportunities plotted along your corridor home. The red A marker is your empty location; the green B is fleet home. Numbered circles show pickup locations, and those numbers match the ranked cards below — including after you use the filters, since the map redraws to show only what you have narrowed to.
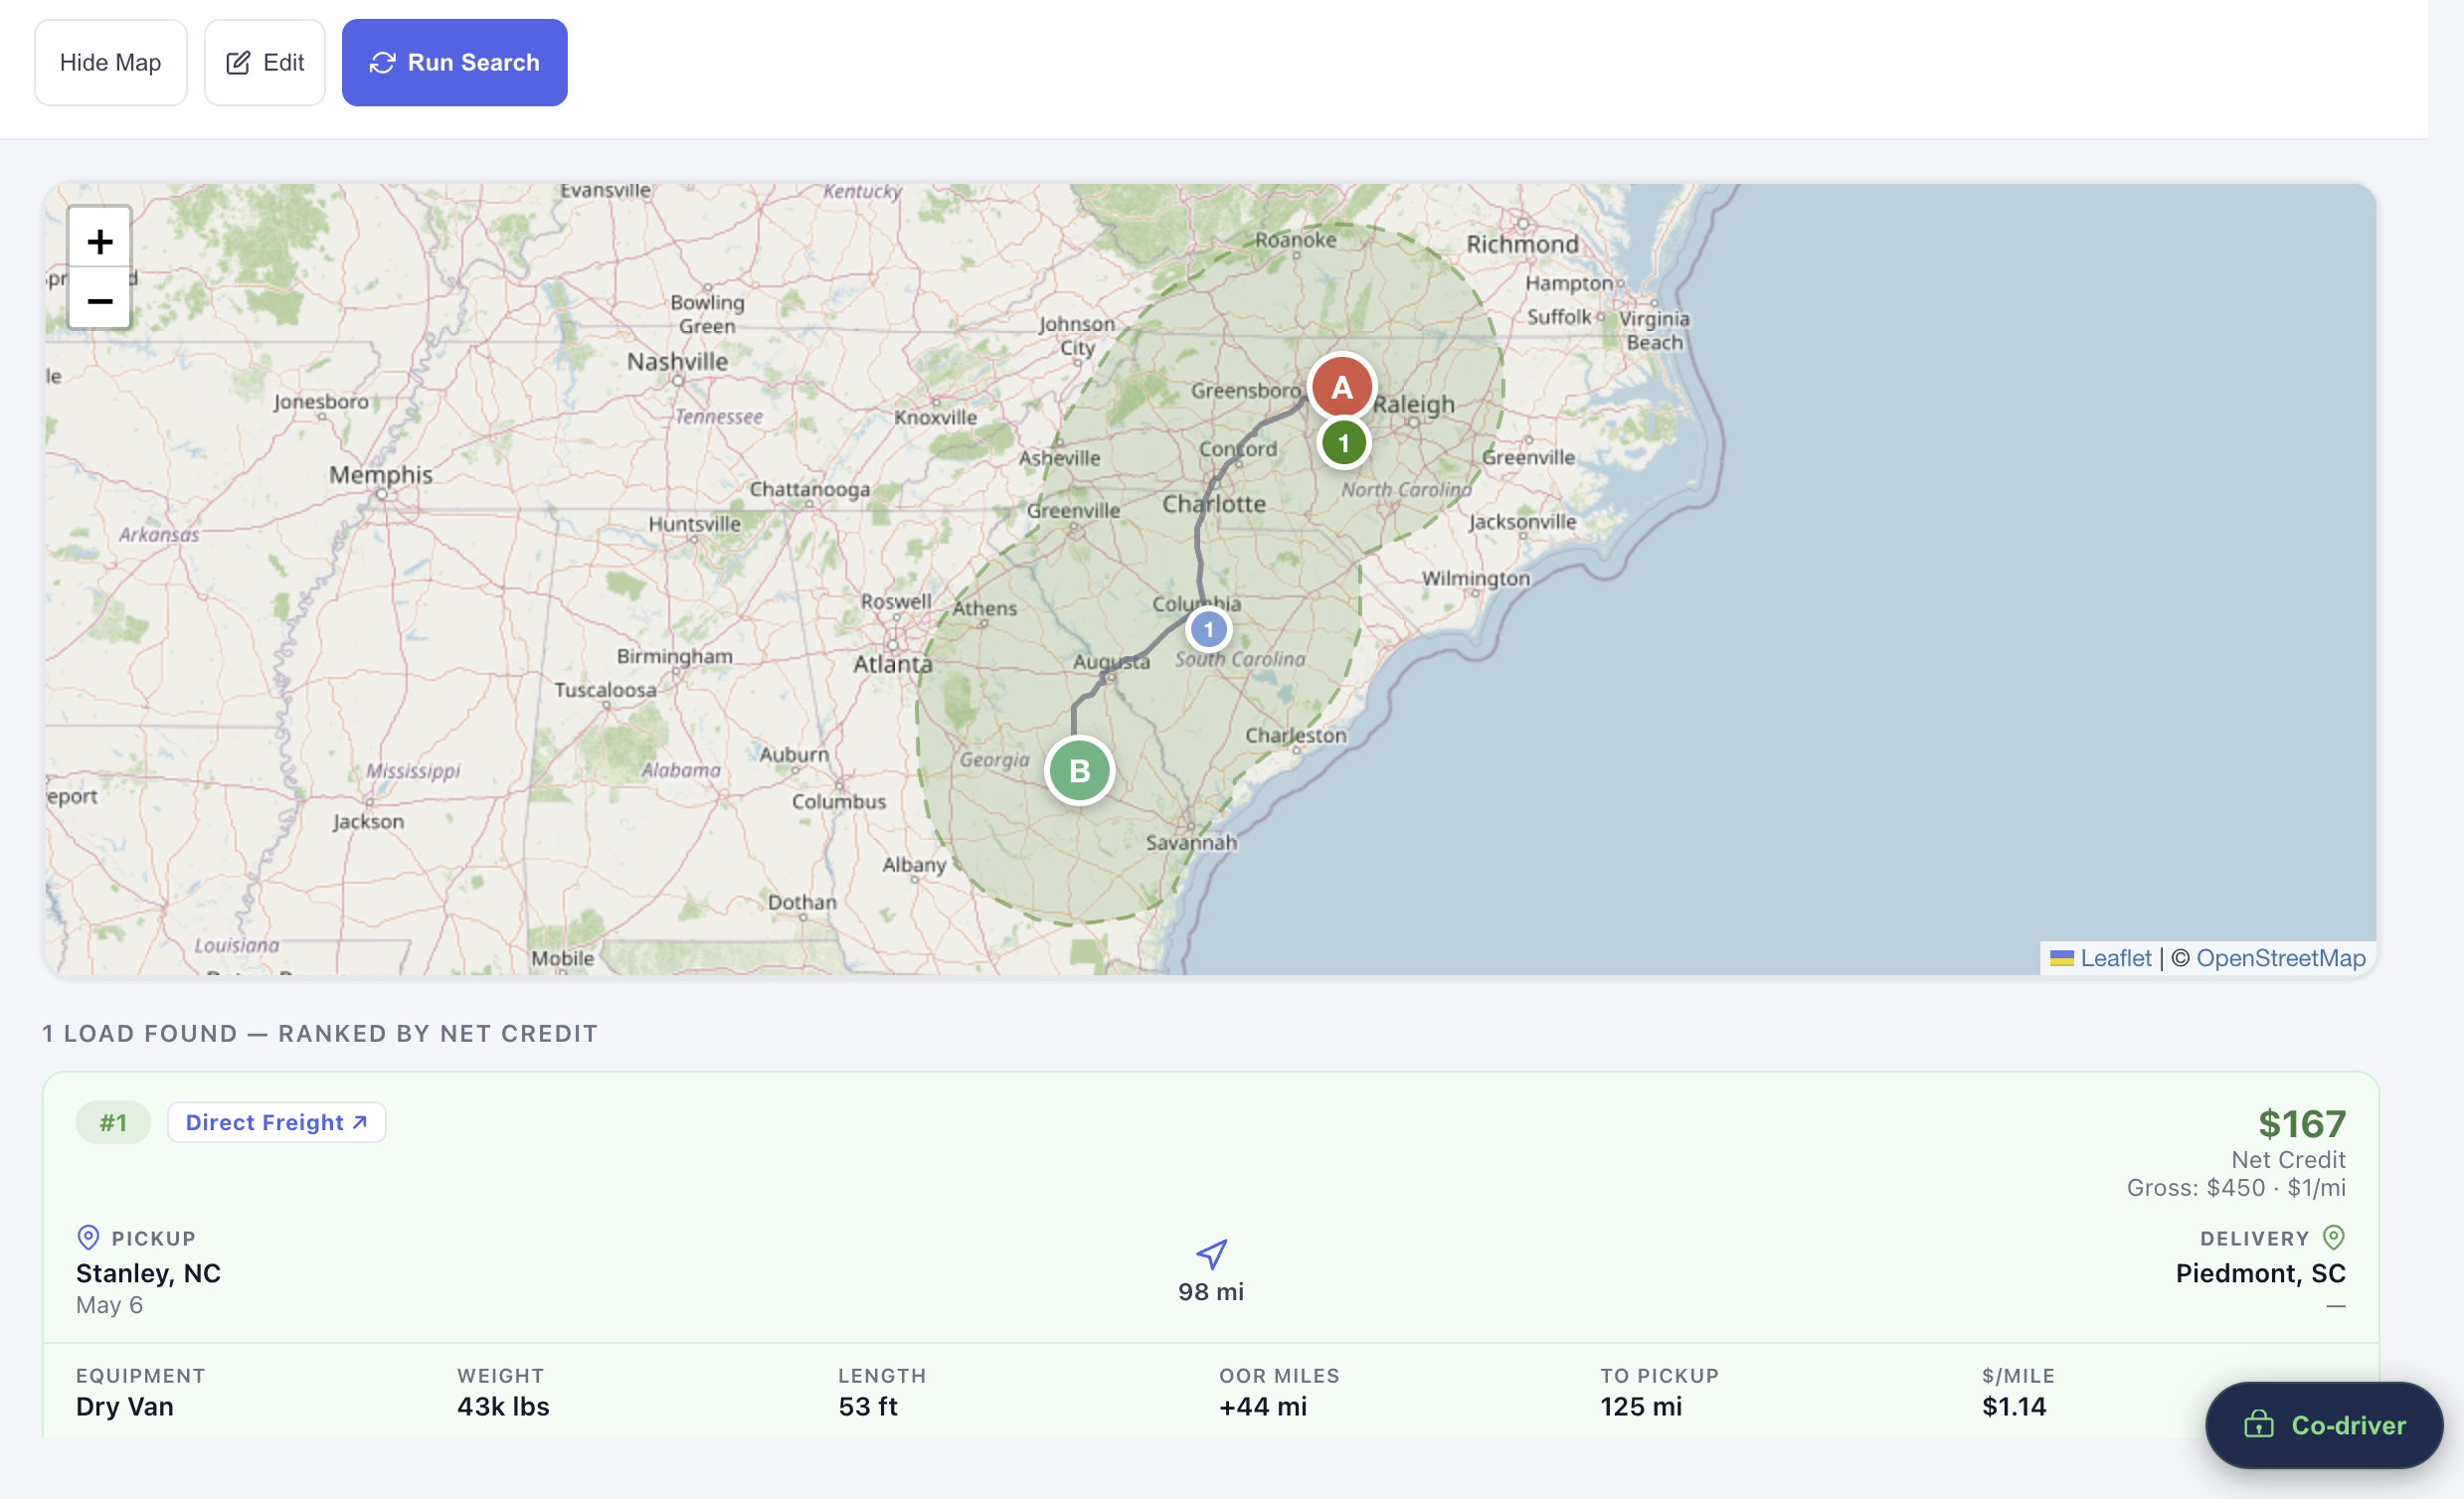
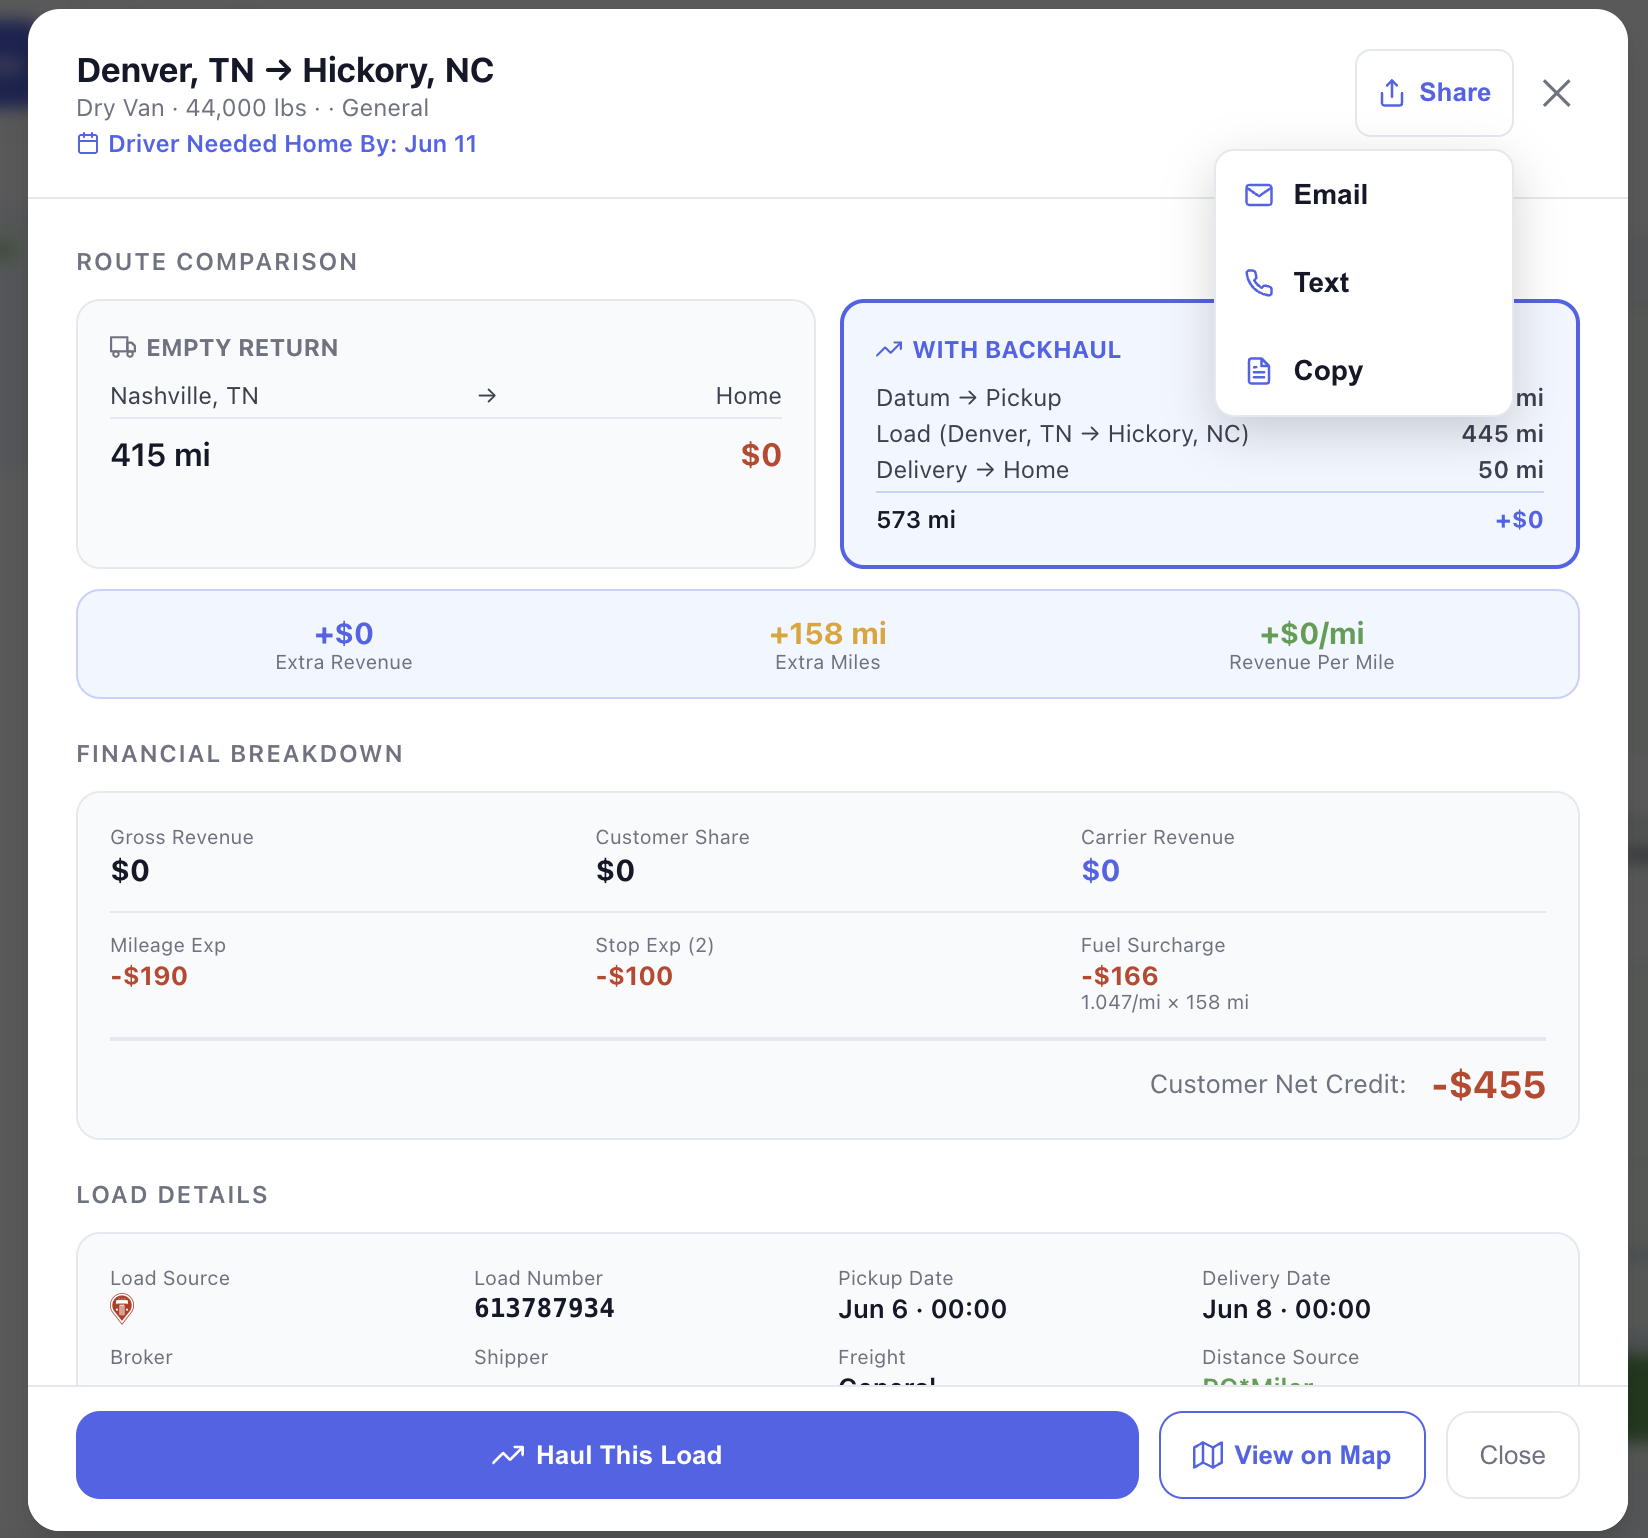
Below the map, opportunities are ranked by Customer Net Credit (highest first) with a full financial breakdown per load.
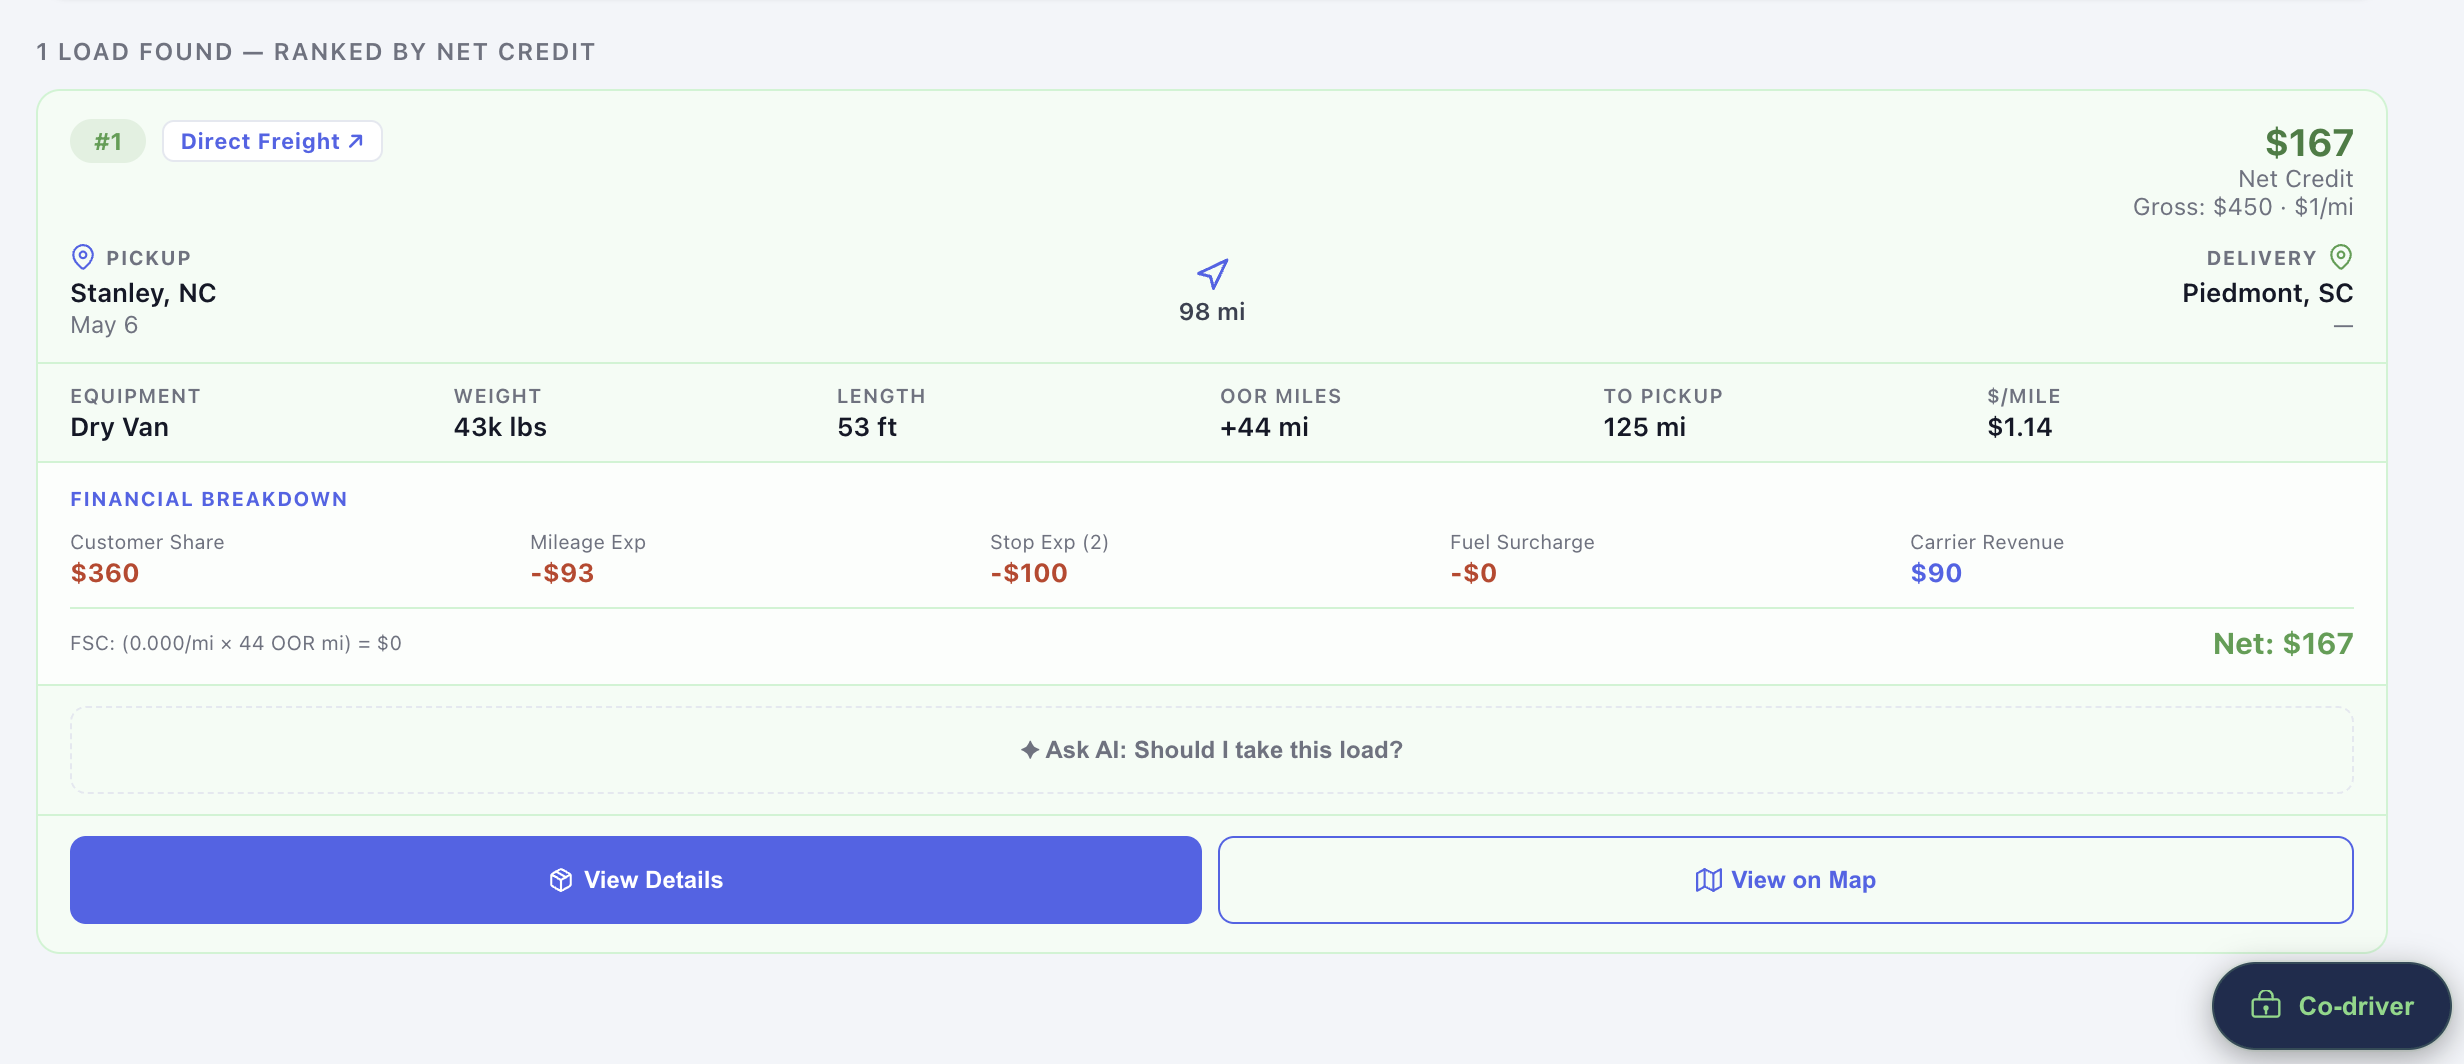
Customer Net Credit
Bottom-line benefit per load: carrier revenue share minus all OOR costs
Gross / $/mi
Total gross revenue from the load and revenue per mile
OOR Miles
Out-of-route miles added versus driving straight home
Empty → Pickup
Miles from your empty location to the load's pickup location
Above the list you'll find Equipment Filters and, where the loads carry enough description, Freight Filters — both visible beneath the map in the screenshot earlier in this step. This is the “narrow later” half of how equipment types work: the search casts a wide net, and these suggested filters let you cut it down to what you actually want to see today.
Equipment Filters
A fixed list of trailer types, showing only the ones present in these results with a count each. Your fleet's own equipment is pre-selected, so a Flatbed fleet lands on flatbed work first and can tick Step Deck or Lowboy back on when it wants the wider board. Loads posted as “flatbed or step deck” count toward both, because either trailer can take them — so nothing hides behind a combination.
Freight Filters
Commodity and handling terms drawn from the loads' own notes — Tarps, Steel, Lumber, Hazmat and so on. Only some boards publish this text, so the heading tells you how many of your results have any: “from 62 of 112 loads that carry freight notes.”
💡
Filtering terms reflect what is in front of you, so they change with every search. One only appears when at least two loads share it — a filter matching a single load tells you nothing you can't already see — and one matching every load is hidden too, since selecting it would change nothing. When there is genuinely nothing to narrow, the row says so: “No filters for this search — all 24 loads are Reefer.”
⚠️
Loads with no freight notes always show. Two of the four boards publish no description at all, so a freight chip keeps them rather than hiding them — otherwise ticking Tarps would silently erase an entire source, which would read as “that board has no tarp freight” when we simply don't know. That is why a chip reading 2 can return far more than two loads, and why the loads that genuinely matched carry a small blue badge naming the term. No badge means the load came through on the “we don't know” rule, not because it matched.
⚠️
Results are estimates only. Always validate mileage figures with your own routing engine before committing to a load.
💡
Use Run Search in the header bar at any time to re-run the search against current load data. If auto-refresh is enabled, it will also run automatically on your chosen schedule.